

Design Goals:
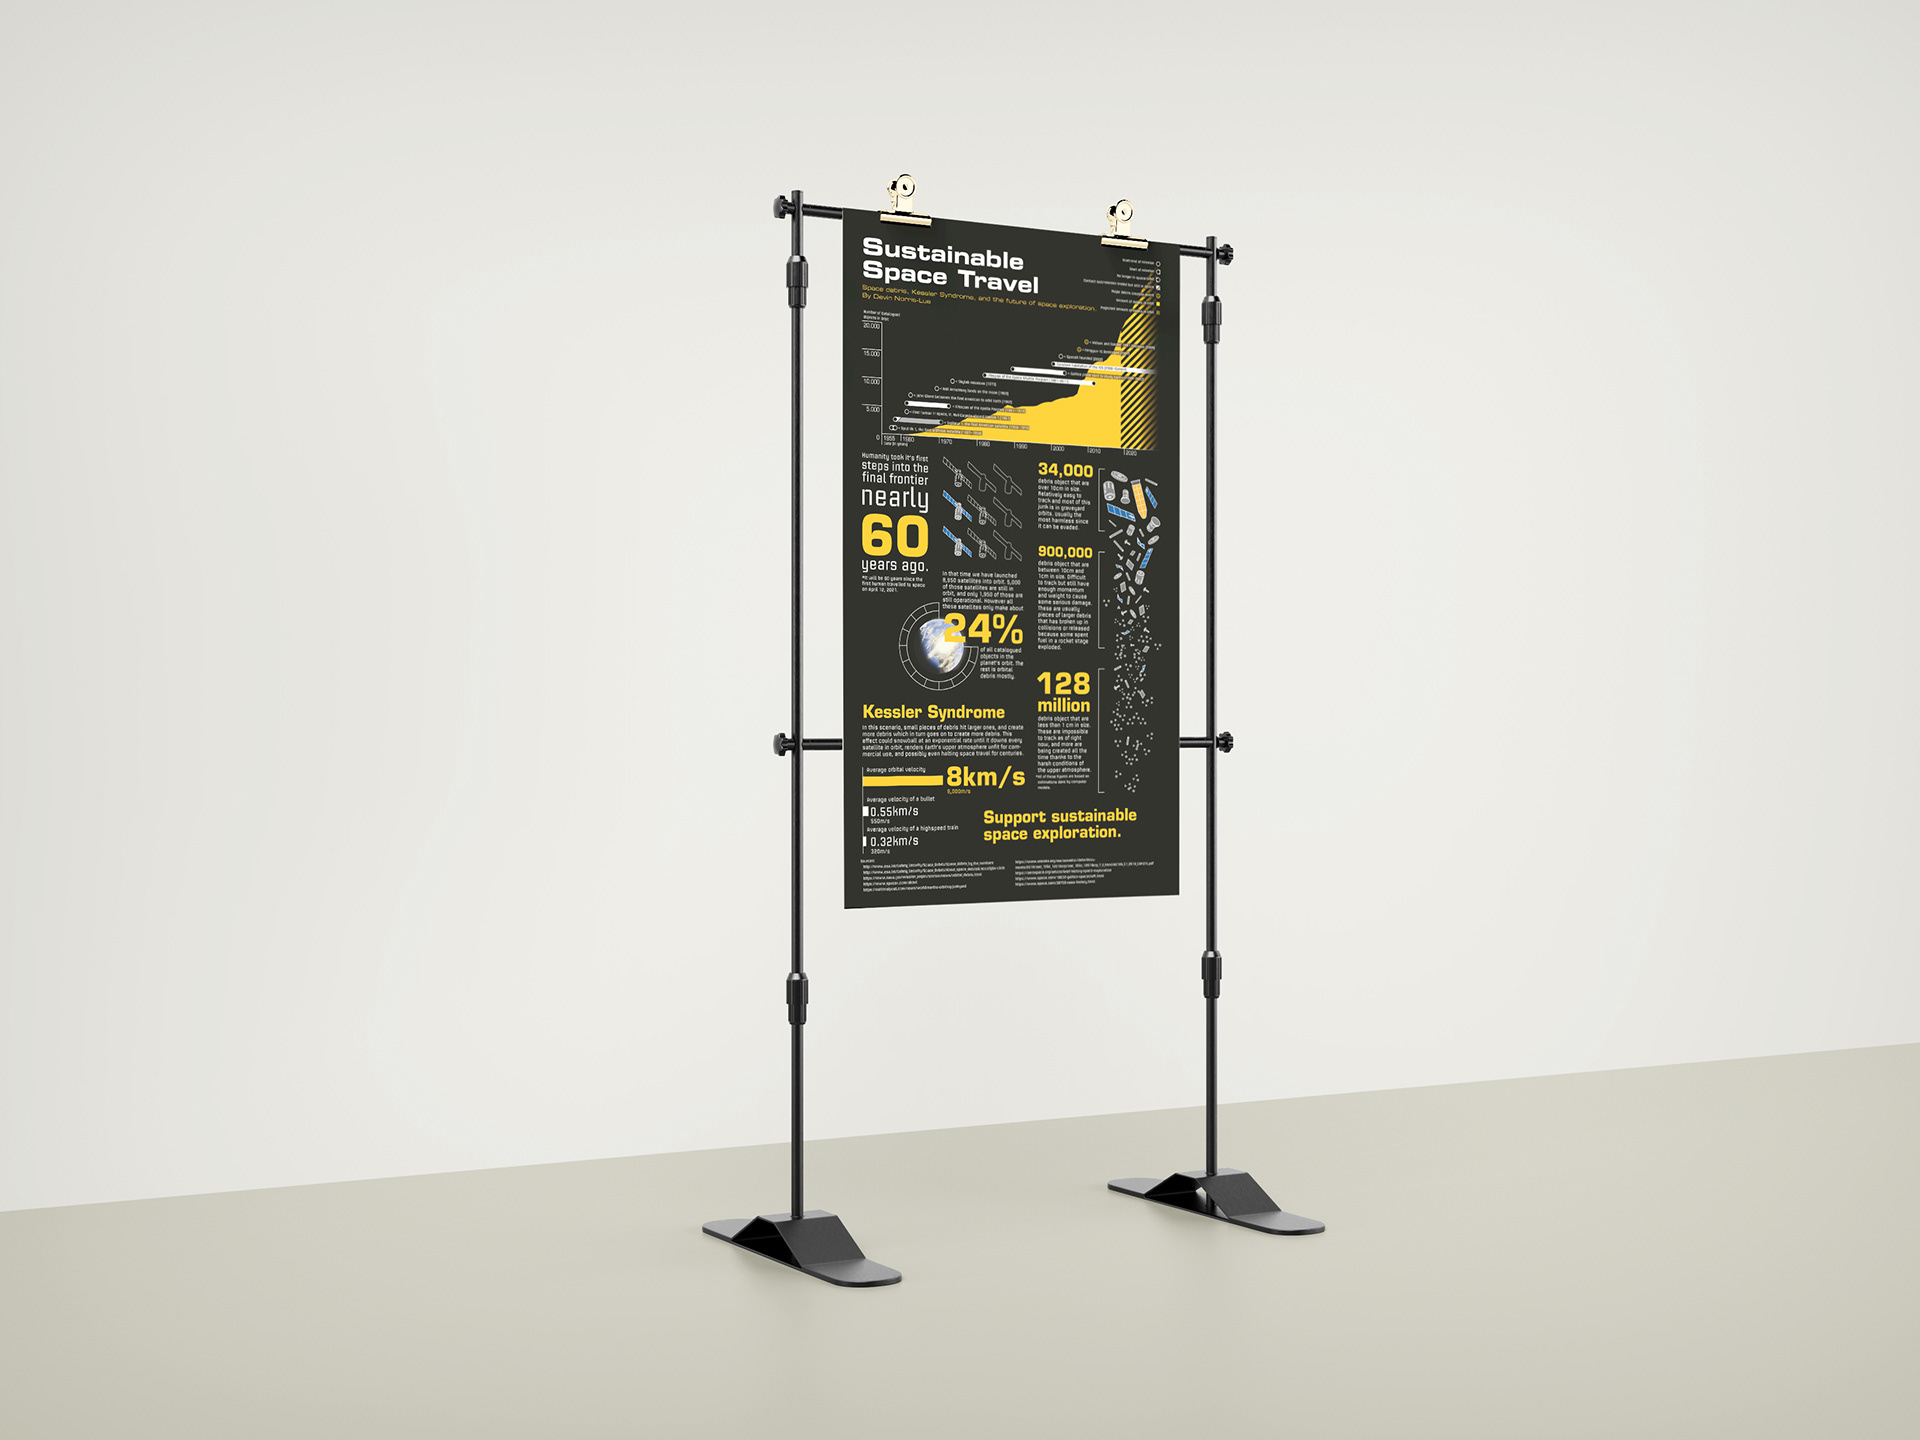
The goal with this infographic on sustainable space travel was to visualize the data in a way that creates a sense of urgency in the viewer to address the issue. This was achieved with the black and yellow colouring which is indicative of warning labels and creates striking contrast. To add to the sense of urgency, a time scale has been added with a prediction cautioning how Kessler Syndrome will only get worse overtime.
As the reader filters down through the information they'll find that the content of the infographic is less about the urgency and appeals more to the proud history of space travel humanity has.

Video:
Translating the poster into video was relatively simple because time is more reliable than the human eye for linearly conveying information. It begins with a warning about the dangers of Kessler Syndrome first, then shows the facts that support that conclusion like the poster does. The visual hierarchy of the poster was almost like a script for the video but with greater control of what information was shown first, which strengthens the narrative that the statistics convey. Finally, like the poster, they both end with a call to action.